Despite the evident reliance of humanity on the vast global ocean—where a staggering 1 billion individuals rely on it as their primary food source, where 260 million people find employment in marine fisheries, where 80% of global trade is facilitated by sea routes, where 30% of the world’s oil is extracted offshore, and where sectors like wind energy, aquaculture, and mining are rapidly expanding—our understanding of the true human footprint or more accurately wake for the ocean is elusive.
On land, our activities are meticulously mapped with roads, highways, forestry, agriculture, and other industries updated often monthly. Our comprehension of the scale, timing, and specific locations of human activities in the ocean remains notably incomplete. Many marine vessels do not broadcast their locations, not detected by public monitoring systems, and often activities are hidden under a veil of commercial and political reasons. Even the best mapping of ships for automatic identification system (AIS), important for seagoing navigation, is not required in some countries, vessel sizes, or some vessel classes. Often, vessels will also turn off their AIS to hid illicit activities.
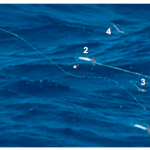
A new study analyzes 2 terabytes of satellite imagery from 2017-2021 using deep-learning models to identify 67 million ocean targets of interest like offshore oil structures and vessels. This data was also combined with 53 billion vessel GPS datapoints to reveal whether the vessel was publicly tracked or was “hidden”.
The takeaways are staggering. By the numbers:
- On average, 63,000 vessels were operational at any given time.
- Nearly half of all vessels were dedicated to fishing activities.
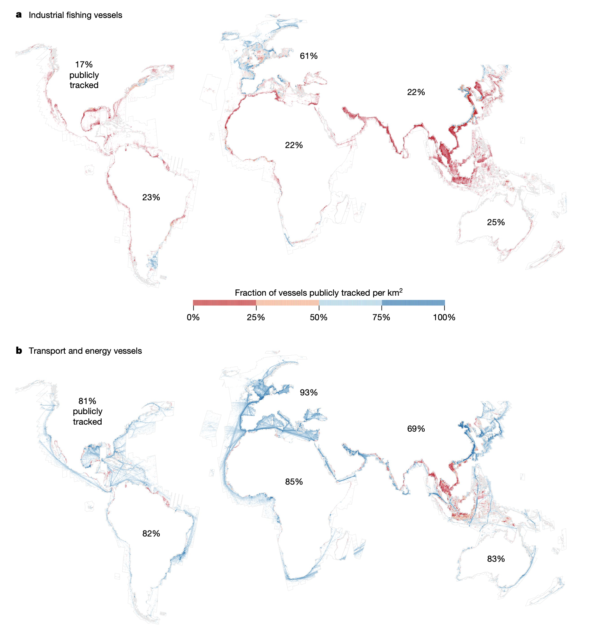
- Around 75% of industrial fishing vessels were absent from public monitoring systems like AIS.
- Half of all vessel activities took place within just 3% of the ocean.
- The breakdown of vessel activity was 67% in Asia, 12% in Europe, 7% in North America, 7% in Africa, 4% in South America, and 2% in Australia.
- Data from AIS lacks accuracy, suggesting equivalent activity levels in Europe and Asia.
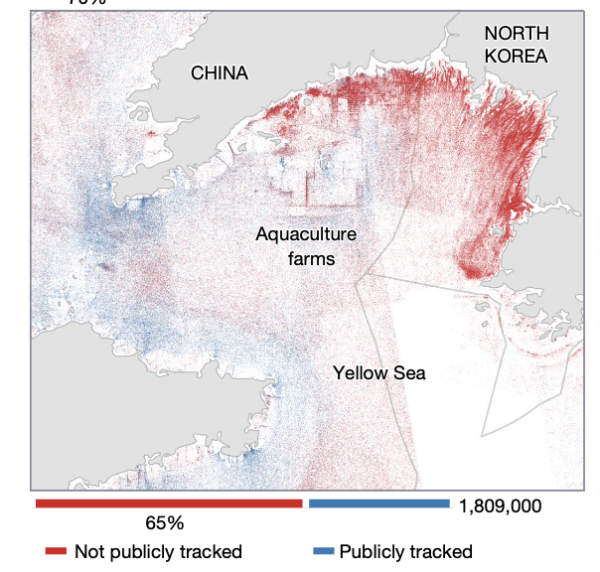
- Most undisclosed fishing activities occurred in the western part of the Korean Peninsula, averaging about 40 vessels per 1000 square kilometers.
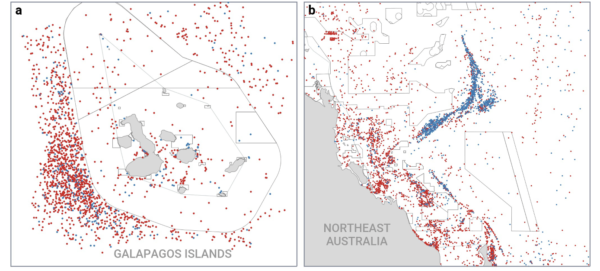
- The two most intensively monitored marine protected areas, the Galapagos and Great Barrier Reef, registered an average of over 5 and 20 vessels per week, respectively.
- Asia housed the highest concentration (65%) of transport and energy vessels.
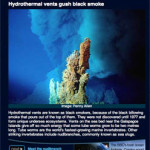
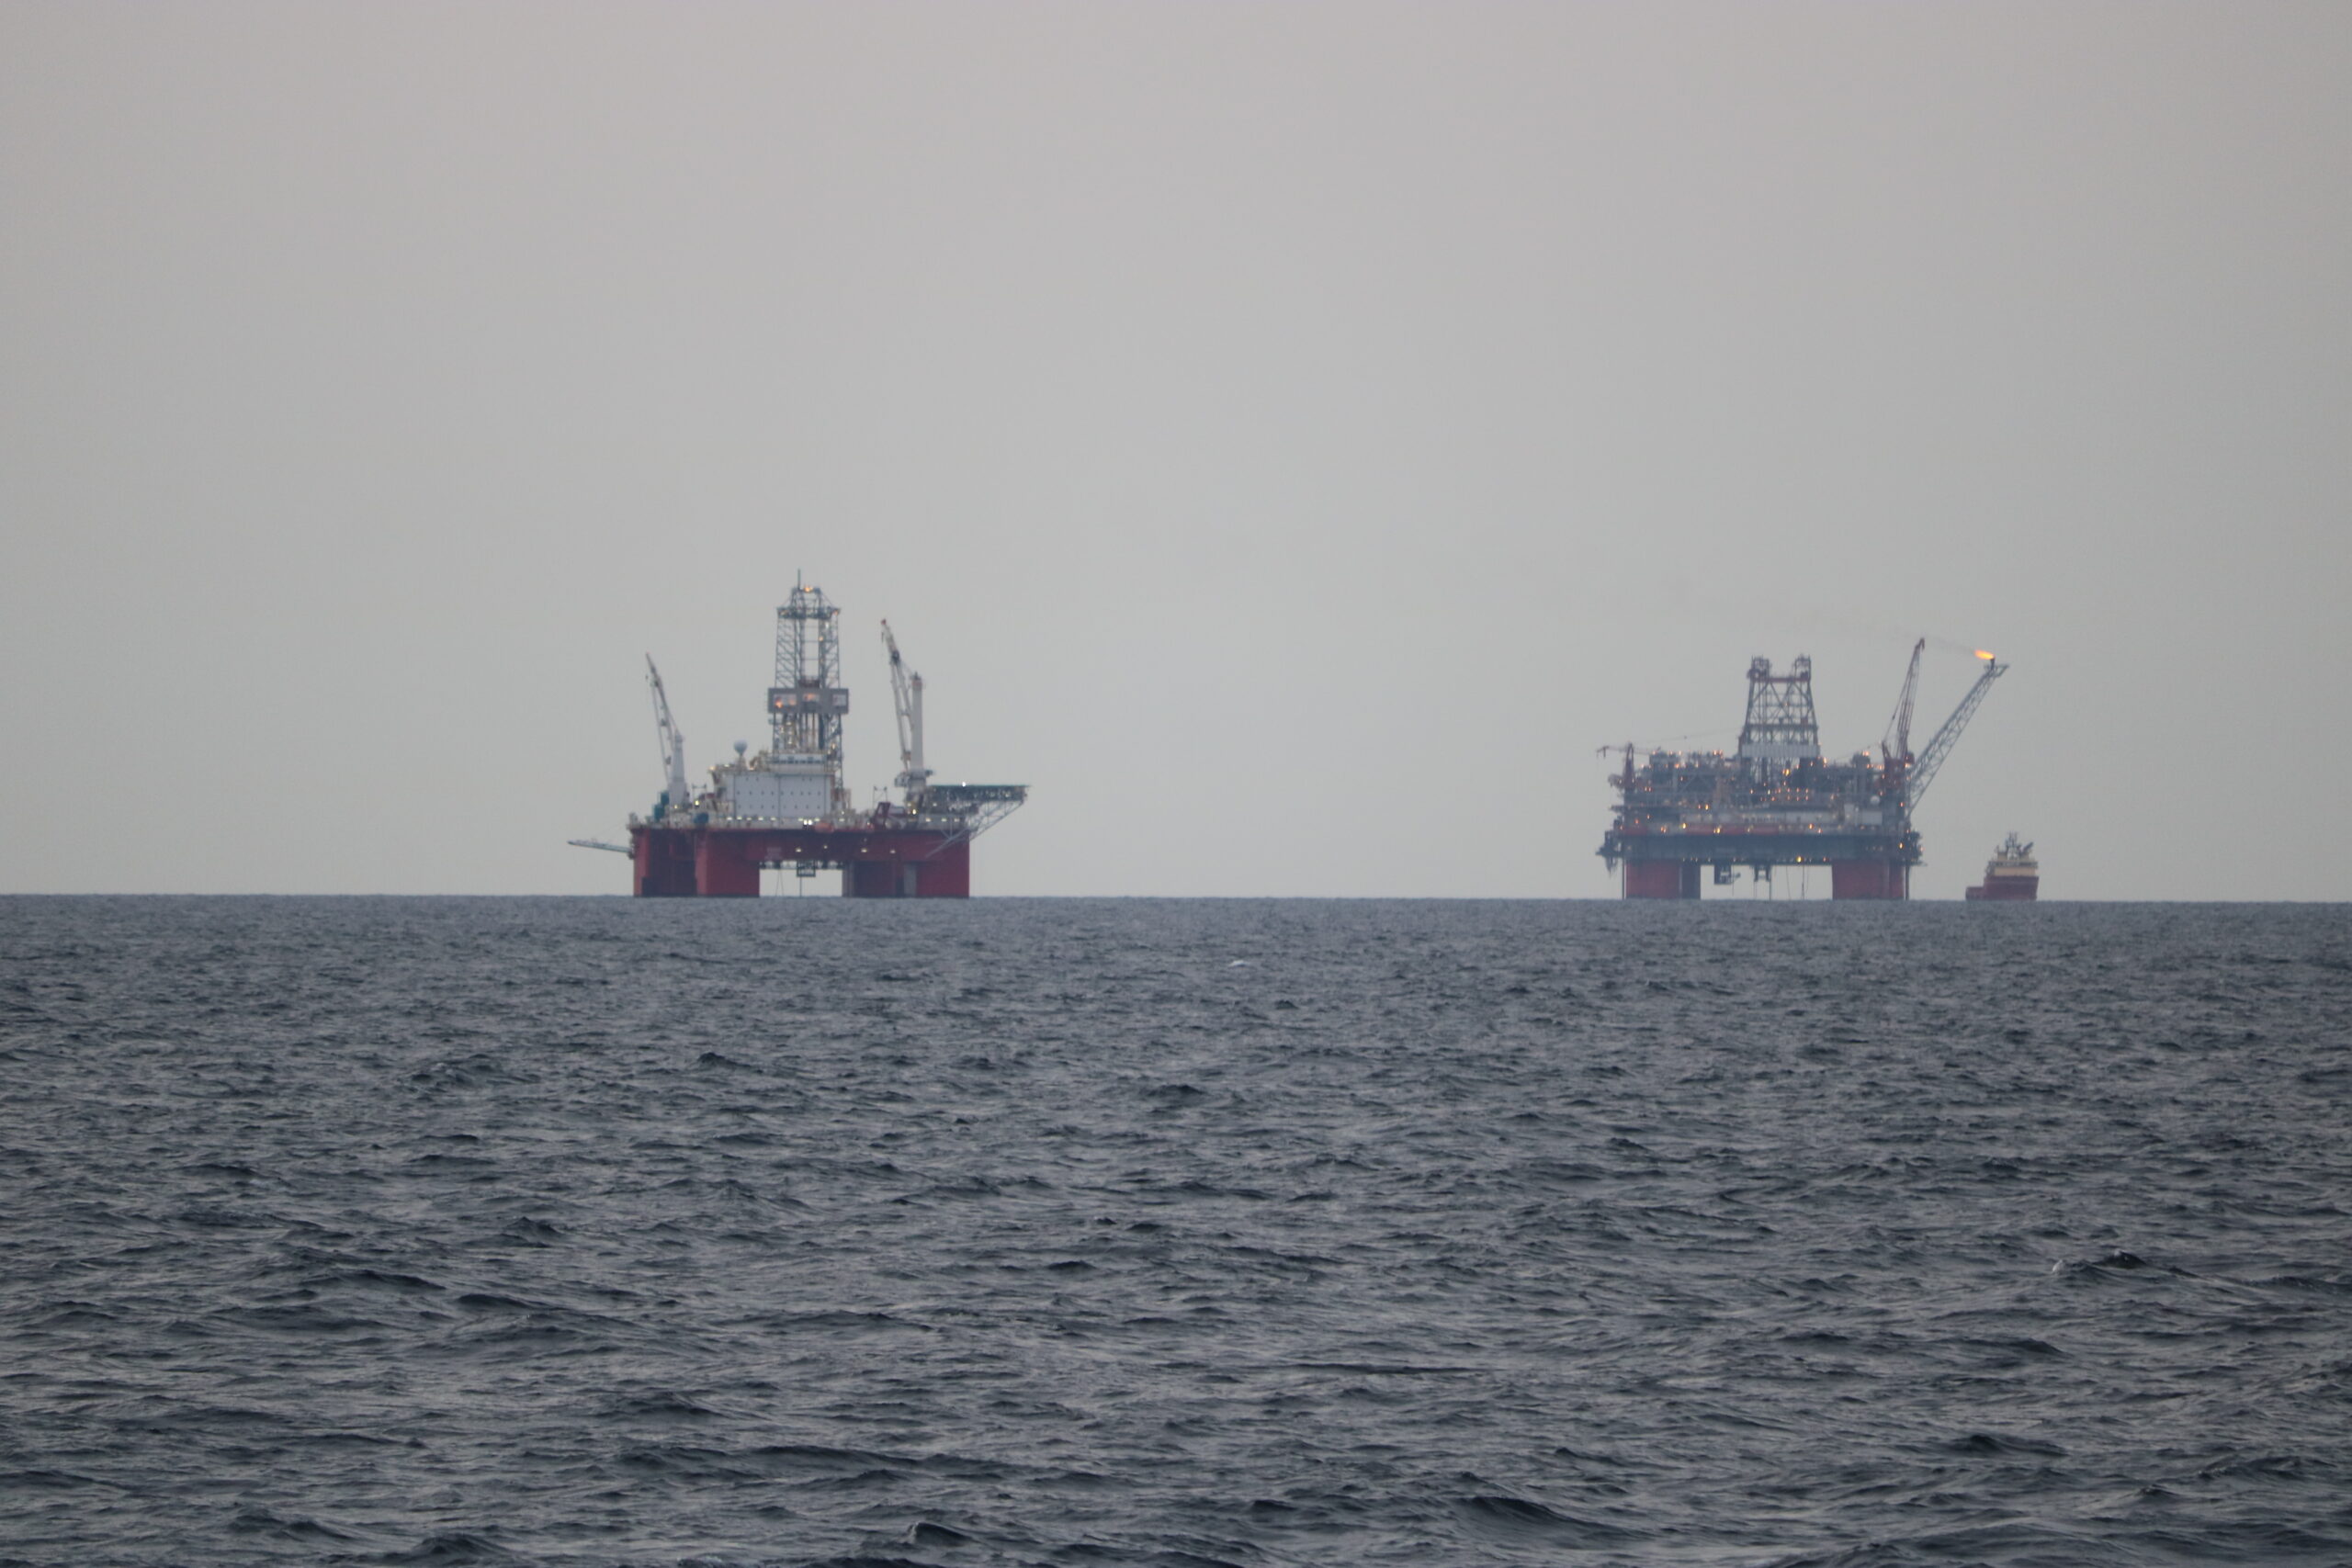
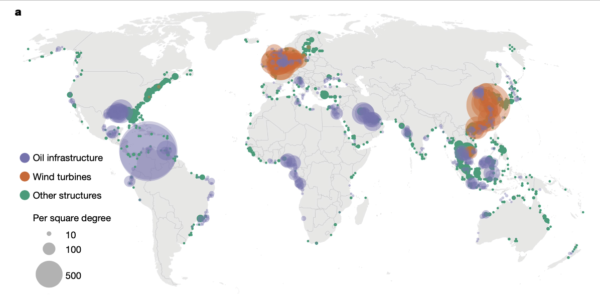
- As of the end of 2021, there were 28,000 offshore structures.
- The Gulf of Mexico hosted the largest concentration of offshore oil infrastructure, with the USA, Saudi Arabia, and Indonesia collectively accounting for 25% of all structures.
- Offshore wind projects were primarily situated in Europe (52%) and China (45%).
In essence, the depths of human activity within the vast expanse of our oceans remained largely veiled, obscured by untracked vessels and undisclosed operations, leaving our comprehension incomplete. Yet, through innovative studies leveraging extensive satellite imagery and GPS data, revealing staggering insights into the substantial presence and impact of maritime endeavors, we’re inching closer to unraveling the ocean’s enigmatic tapestry, one dataset at a time.
Paolo, Fernando, et al. “Satellite mapping reveals extensive industrial activity at sea.” Nature 625.7993 (2024): 85-91. PDF Here