I apologize, as this post is a little belated. I have been back from a trip to take down a seasonal HF Radar array on the North Slope for nearly two weeks now. Quite frankly, I underestimated how exhausting it was to work outside in the cold. And the reality was, the weather was actually pretty nice. A balmy -10F with no wind. That sounds cold, but it could have been much worse (currently it’s -26F with a windchill of -36F there). Even with that, I managed to get some frost nip on the tips of my fingers (which still feel weird). But to get to experience the deep Arctic Winter and meet some of the people that live there was AWESOME. We took a jet to Barrow, the northernmost city in the US, then took propellor planes to the small Alaskan villages of Point Lay and Wainwright. The trip was timed perfectly, as a full moon eerily illuminated the frozen Chukchi Sea.


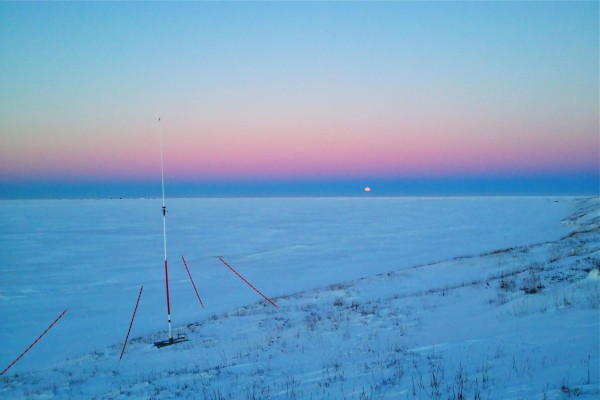
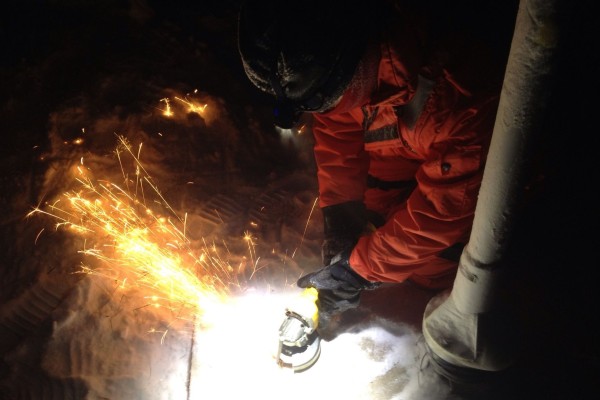
While the scenery was amazing, we did in fact have a mission. And that was to take down the 6 antennas (3 at each site) that make up a HF Radar array. The HF Radar is land-based instrument that oceanographers use to measure surface currents. It does this by transmitting electromagnetic radio waves out over the ocean, where they are reflected back from waves at the surface. The reflected waves are then measured by a receive antenna, also onshore. By figuring out how the transmitted waves change after reflection, we can determine the speed of water at the surface. And there are some pretty rad physics that make measuring ocean currents from land possible.
1) The frequency of the transmitted radio waves are specifically chosen so their wavelengths are exactly twice that of the majority of surface ocean waves. Why twice? Well the system exploits a physical phenomena known as Bragg scattering. Bragg scattering occurs when an electromagnetic wave is reflected from a grate. Wavelengths at twice the spacing of the grating are then amplified when reflected. To the radio waves emitted by the HF radar antenna a train of ocean waves looks like a grating. So the radio waves that will be amplified are those that are twice the wavelength of the surface waves! Surface waves have wavelengths that range from about 6-30 meters, so to get the strongest reflection, the transmit antenna broadcasts radio waves have wavelengths from 12-60 meters. This corresponds to electromagnetic waves ranging in frequency from 5-50MHz. For radio hams, this is also the band that short wave radio operates at.
2) If you look at the ocean, you can easily see surface waves are not stationary. They move because they are propagating, but they also move because they are pushed by the underlying surface currents. This means that the grating from which the HF radar waves reflect from is moving. This causes another physical phenomena, doppler shifting, which occurs when waves are reflected from a moving object. Doppler shifting changes the frequency of the radio waves reflected from the surface ocean waves. We know what frequency the HF radar transmits radio waves at and therefore we know the frequency that the reflected radio waves should have due to Bragg Scattering. However, due to doppler shifting caused by the waves being moved by the underlying currents, the reflected radio wave that is observed at the receiver antenna onshore have a slightly different frequency than what we would expect. Surface waves moving away from the receiver antenna will cause the reflected waves to have longer wavelengths and therefore lower frequencies, while surface waves moving towards the antenna will have shorter wavelengths and higher frequencies. By calculating the difference between the expected to the observed frequencies of the reflected radar waves, we can determine the speed of the underlying currents!
3) Lastly, the receive antenna can only measure the speed of waves moving directly towards or away from it, in other words the radial velocity. But what we want is speed AND direction. For that we we need two surface current vectors. So how do we do that. Easy, MULTIPLY AND CONQUER! By deploying another HF Radar system father up the coast so that their radial vectors overlap, we get two vectors! Then using a little trigonometry, we can now calculate the direction and speed of the surface currents.

I mentioned that in order to be successful, HF Radar systems must multiply and conquer. Well, they have this strategy down pretty well. Don’t be alarmed, if you live near the coast in the Lower 48, there is probably an HF Radar system measuring your currents RIGHT NOW! You can check out a realtime map of all the HF Radar sites in the US right here http://hfradar.ndbc.noaa.gov/. Pretty awesome.
Just like most things Alaskan, our HF radar system is a little different than those in the lower 48. Down south, HF Radar are permanent installations. Up here, we have to deal with sea ice and brutal Arctic winters, so we take them down seasonally. Every spring, we head up there to set them up, then take them down again in December. At the site near Point Barrow, the HF radar system another obstacle, its predator the Polar Bear. I say that in jest, but they have been known to munch on some of the cables.
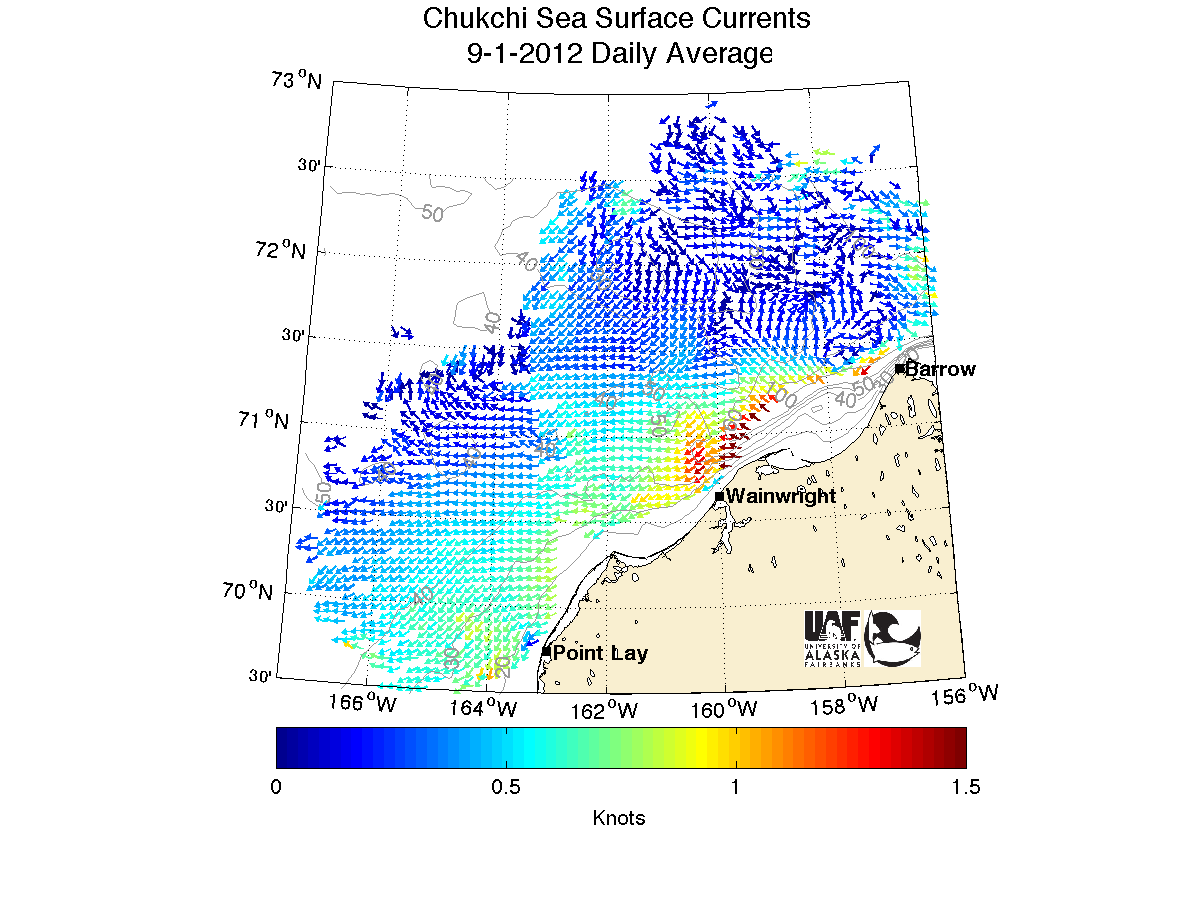
HF radar systems give us a lot of data. They give us large scale maps of coastal surface currents and illustrate how these currents change in time. By comparing the HF radar data to wind data or even tidal models, we can figure out which dynamics drive these currents. In terms of biology, knowing which way the surface currents are moving gives us information on where nutrients are going, or where they are not. And even more importantly, the realtime data can be used to respond to man-made disasters such as oil spills or waste dumps. Figuring out where pollutants may go is key to figuring out how to contain them.
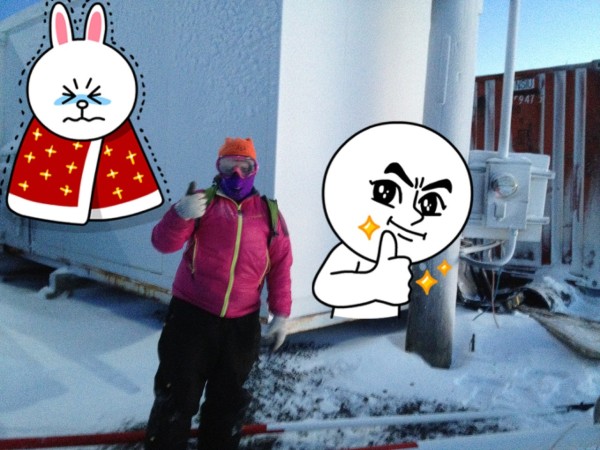
In my last post, I promised to post a picture of me in all my gear. Since it wasn’t so cold out, I did not don the über fur-lined jacket. I did wear, from top to bottom: Wool hat, ski goggles, neoprene facemask, puffy jacket, fleecey top, liner gloves, work gloves, down over mitts, fleecy pants, insulated Carhartt bibs, two pairs of socks and finally the -100F rated boots. My coworker did get one photo of me in the gear I did wear, so I am posting it here. Inexplicably, he illustrated it with two of his floaty friends.