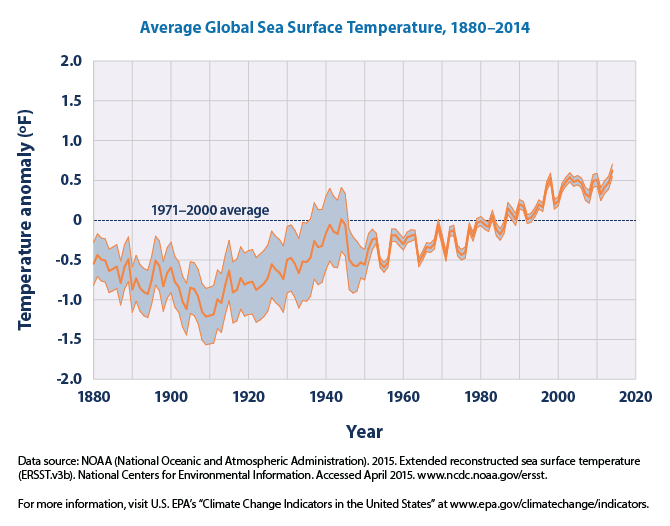
Recently, on Twitter and Facebook I noticed graphs of climate change and its impacts being posted. These were often unaccompanied with data sources or links. A…
View More A Story of Climate Change Told In 15 GraphsTag: graphs
Confronting Climate Contrarianism III: Data Realism and the Rabbit Hole
A new addition to my Confronting Climate Contrarianism series, much too long in waiting. Found this interesting animated gif on Andre Nantel’s G+ stream. He…
View More Confronting Climate Contrarianism III: Data Realism and the Rabbit HoleDSN Scientist in Residence Eric Heupel Revisits Gulf of Mexico Dolphin Mortality Event
Eric Heupel is a graduate student at University of Connecticut in Oceanography. He keeps a personal blog at Eclectic Echoes and Larval Images, and used…
View More DSN Scientist in Residence Eric Heupel Revisits Gulf of Mexico Dolphin Mortality EventConfronting Climate Contrarianism II: Methane Accumulation in the Atmosphere
Confronting Climate Contrarianism looks into the claims made climate contrarians and how they (mis)use the scientific literature. —————————————————————– In a textbook example of climate contrarians…
View More Confronting Climate Contrarianism II: Methane Accumulation in the AtmosphereZombies and Submarines
One of my long time favorite sites is Graph Jam. The idea is graphs are presented that represent cultural norms, comedic concepts, etc. Of course,…
View More Zombies and Submarines
