A new addition to my Confronting Climate Contrarianism series, much too long in waiting.

 Found this interesting animated gif on Andre Nantel’s G+ stream. He found it with no attribution on Reddit (UPDATE: graph from an excellent post on Skeptical Science). Gernot commented on that stream with a link to a Sydney Morning Herald piece “Rift in Antarctic glacier to create gigantic iceberg” (which is really a news wire from AFP). In it, Michael Studinger, a member of the NASA IceBridge team, is paraphrased as stating that the process is not the result of global warming but is part of a natural cycle of ice calving from the glaciers.
I didn’t know much about the relationship between ice sheet calving and global warming, so I googled it. Ice sheet calving is pretty much a mechanics process – when the front end weight puts too much force on the ice sheet it causes strain and thus fractures at its breaking point. Its like putting a thin piece of wood over the edge of your desk. Push down on the floppy end of it and eventually it cracks and breaks apart, it just depends on how much is hanging off the edge and the force of the downward pushing weight on top; the rest inevitable.
I found another Australian article published today at Independent Media Centre Australia that goes into much more depth and is well-referenced. The author, who goes by “takver”, connects the dots in a way the AFP (Agence France-Presse) doesn’t (or can’t). It’s true that calving is a natural, cyclical process predicted and easily derived from physics. But what is missing from the narrative is the acceleration of the process by warming oceans. Takver writes,
The neighboring Pine Island glacier has been undermined from below by warmer ocean water speeding the melting and discharge of the glacier as a whole. Scientists used a remote controlled submarine in 2009 to study underneath the Pine Island ice shelf and discovered a ridge about half the size of the one anchoring the Thwaites glacier. They estimated the Pine Island glacier detached from this ridge in the 1970s starting the process of ocean water undermining the glacier.
“More warm water from the deep ocean is entering the cavity beneath the ice shelf, and it is warmest where the ice is thickest,” said study’s lead author, Stan Jacobs, an oceanographer at Columbia University’s Lamont-Doherty Earth Observatory.
The Pine Island glacier’s ice shelf is now moving 50 percent faster than it was in the early 1990s. Pine Island Glacier is moving into the sea at the rate of 4 kilometers a year — four times faster than the fastest-moving section of Thwaites.
Ice sheets are being undercut by warm water. This was also highlighted in a recent study published in Nature Geoscience. I won’t rehash it here, go read takver’s more in depth and well-referenced article at IMCA. The punch-line is right there in the entire abstract of Jenkins et al. (emphasis added),
Thinning ice in West Antarctica, resulting from acceleration in the flow of outlet glaciers, is at present contributing about 10%of the observed rise in global sea level. Pine Island Glacier in particular has shown nearly continuous acceleration and thinning, throughout the short observational record. The floating ice shelf that forms where the glacier reaches the coast has been thinning rapidly, driven by changes in ocean heat transport beneath it. As a result, the line that separates grounded and floating ice has retreated inland. These events have been postulated as the cause for the inland thinning and acceleration. Here we report evidence gathered by an autonomous underwater vehicle operating beneath the ice shelf that Pine Island Glacier was recently grounded on a transverse ridge in the sea floor. Warm sea water now flows through a widening gap above the submarine ridge, rapidly melting the thick ice of the newly formed upstream half of the ice shelf. The present evolution of Pine Island Glacier is thus part of a longer-term trend that has moved the downstream limit of grounded ice inland by 30 km, into water that is 300 m deeper than over the ridge crest. The pace and ultimate extent of such potentially unstable retreat are central to the debate over the possibility of widespread ice-sheet collapse triggered by climate change.
The last part is important because it links ice-sheet collapse to warmer water temperatures, creating the connection that I was wondering about. Indeed there is a connection between global warming and shelf collapse. It’s an acceleration, which I’ve emphasized from the abstract above. Acceleration is important because it means a positive change over time.
This means that the deteriorating conditions are getting more and more worse each day. Sort of like a chain reaction. Warm water undercuts the ice sheet, melting it from beneath which removes the contact with the seafloor and thus more sheet is overhanging, adding more unsupported weight to the end of that mass. Eventually the strain is too much and the ice sheet snaps. This is what we are watching in real time now at Pine Island.
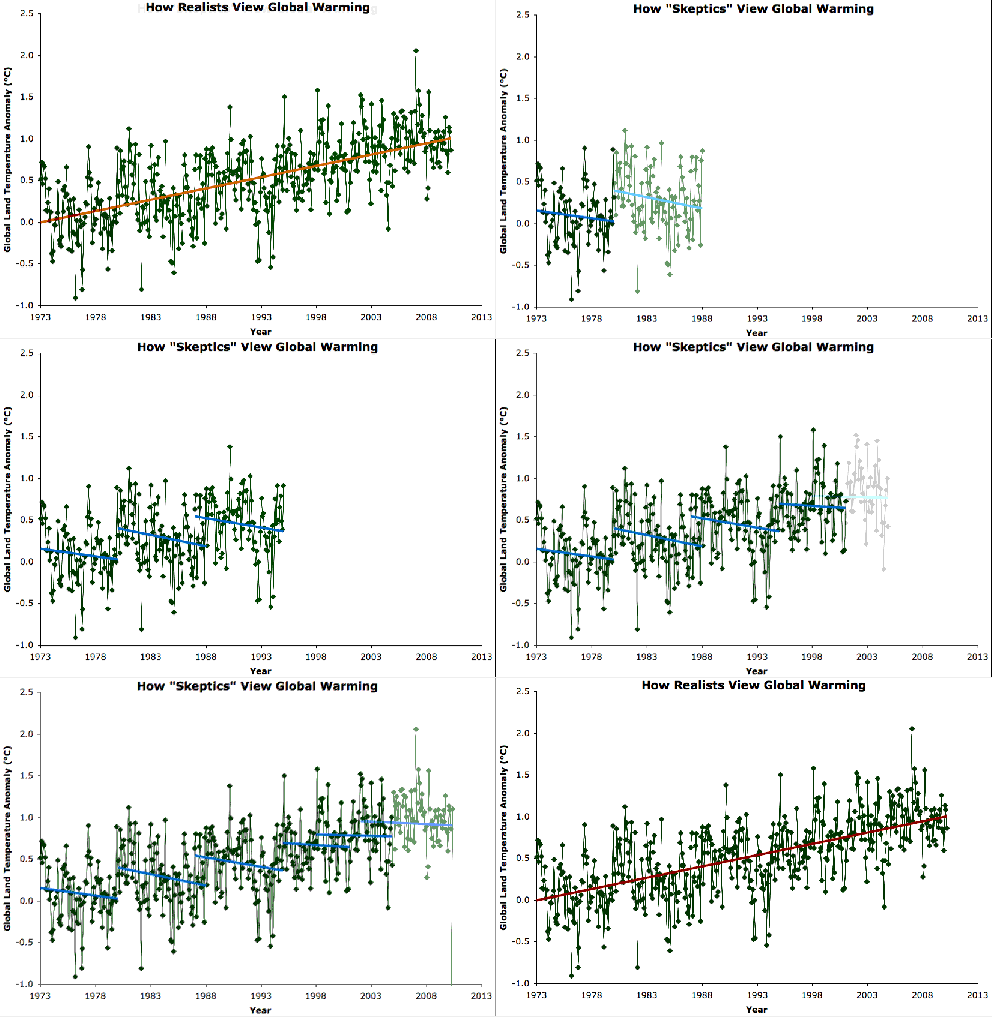
What does this have to do with an animated gif from some person’s stream I follow Google +? It shows rather nicely how climate change contrarians might see the same data differently from climate scientists. Parsing out the same data in creative, and frankly dishonest, ways lets the contrarian bend the data to fit their agenda. The purpose of accumulating data over time is to see the overall trends from the start of data collection to the most current data point.
Selected comparisons within the data set are meaningless to the original guiding question. To paraphrase my graduate advisor after I spent weeks analyzing the same data every which way possible: you can go on fishing expeditions all you want but the deeper you go the more likely you’ll come up empty-handed. His motto was also Kiss It Simple, Stupid. A rookie mistake is to stray off topic too much from your guiding research questions and try to find hidden meaning in your data. I quickly found out I can spiral quickly downwards into a rabbit hole of madness with multiple comparisons and strange data parsing giving me conflicting or unrealistic interpretations.
I think this is what we are seeing to some extent with contrarians. They have spent untold hour locked away in a cubicle crunching the numbers any possible way to show that there are no real trends in global warming. They have in effect descended into their own rabbit holes of madness trying to disprove an insurmountable glacier of independent evidence in support of warming temperatures and oceans. Unfortunately, their madness takes them to the public stage where they are more adept at confusing people.
Share the post "Confronting Climate Contrarianism III: Data Realism and the Rabbit Hole"


The graph is from Dana of Skeptical Science. The mirror-image “alarmist” cherry-picked argument could fit a quadratic curve to a segment of data showing “accelerating” global warming :)
“Unfortunately, their madness takes them to the public stage where they are more adept at confusing people.”
Familiar with that. Every time I blog in support of global warming science I am taken to task by denialists who accuse me of a “religious” belief. Denialism is an amazing phenomenon. How anyone could believe in a worldwide conspiracy of scientists is beyond me.
Thanks a ton for the source! I hate improper attribution on the net. I need to read Skeptical Science more. Thanks for commenting!
I have a post in my back pocket about when a “cult” is not actually a cult in science. Contrarians like to use the “towing the line” pseudoargument as if its a bad thing. But alas, that is how science works… we all tend to believe the evidence until new evidence convinces us otherwise.
I am glad you found my article on Global warming and Antarctica informative. It had been on my radar to write something on the changes happening at the Pine Island Glacier, Thwaites Glacier and WAIS for a couple of weeks. I have been adding links on my news posts to source information for quite some time…a good practice as it allows the reader to dig deeper if necessary, and it means I am more likely to be trusted as a source. Good net journalism.
Thanks for the attribution!
I love the animated GIF at the beginning of the article. Great work in digging it up. I just found this site and I am very impressed and excited to see another group of scientists communicating science to the public; no matter how controversial!
Great Work Everyone.
Andrew
Thanks Andrew, we’ve been here for over 6 years doing our thang! Glad you can join us!
Global warming DRIVES C02 levels – with question and without exception.
There is No physical evidence to support the hypothesis that C02 drives or even influences temperature. Anyone claiming such is either an ignorant fool or and liar.
The claims made by the AGW (Anthropogenic Global Warming) hypothesis are NOT supported by the physics involved. It has been proven without question that it is an effect does not and cannot exist – period.
Surly any idiot can understand the simplest of thermodynamics in that cool things DO NOT warm up warm things – for example we do not put ice in a drink to warm it up. Yet this is exactly what the AGW and c02 driven global warming hypothesis claim – it is utter nonsense!
I’m astounded that people actually believe this non-scientific garbage.