 In a recent paper, de Jonge et al used x-ray fluorescence tomography to give us a new perspective on how diatoms put together those phenomenally intricate frustules of theirs. “X-ray whosamagidget” you say? My thoughts exactly. Let’s break it down. First: X-rays. High-energy waves that help doctors see our bones. Check. Second: fluorescence. Fluorescence is light released when an electron that has been excited calms down. Each element has a unique constellation of electrons surrounding it, and so each element will give a unique fluorescence signature. Ok, check. Third: tomograhy. Tomography is simply the technique of layering 2-D images on top of each other to produce a 3-D image. Check!
So, x-ray fluorescence tomography shoots a sample with x-rays, the x-rays excite electrons, as the electrons relax back into their base orbitals, they release a pattern of light that is specific to the element they belong to, thus creating an elemental map for your sample. Stack enough of these on top of each other, and you get a 3-D image by element of what it is you’re interested in. Sweet!
 De Jonge et al. did this for a centric, freshwater diatom, Cyclotella meneghiniana, though they point out the technique could easily be used for marine species. This diatom is only about 12 μm in diameter, yet the technique enables visualization of element distributions at a very fine scale (400 nm resolution, in fact). For anyone concerned with how diatoms are using metals (like me), this is outright phenomenal.
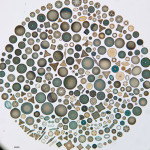
Of course diatoms, like all living cells, need metals to function. But, because they make hard parts out of opal instead of calcium carbonate (like sea shells and coral) or apatite (like our teeth and bones), diatoms have always been a bit weird. Unlike bones, coral skeletons, or sea shells, diatoms are also really, really small. The largest diatoms get up to about a millimeter, and the smallest are just a couple of micrometers.
Because they are so small, we don’t know much about how they form their frustules. We’ve known that they lay down the opal on a matrix of organic matter, and we’ve known that some metals get mixed in there as well. But, that’s about it. Why the metals were there caused a lot of doubt about the quality of the measurements, and confused more than a few scientists. Iron was particularly confusing, since it’s so darn useful in the cell, and there are huge swaths of the ocean that are limited by iron (the Southern Ocean, the Equatorial Pacific, the North Pacific, and various coastal regions of upwelling). Why lock such a precious resource away in your “skeleton” where you can’t get to it?
This paper justifies those scientists who were doubted, and it starts to clear up some of the confusion. Thanks to this technique, we see that iron is not randomly strewn about the cell all willy-nilly. Rather, it appears specifically in bands where the diatom is adding girdle bands; the opal bands that diatoms add on in the middle so they can grow yet remain surrounded by opal. Also interestingly, the manganese appears only at the ends of the valves (the top and bottom of the frustule), and so appears to be useful in putting together the ends of these frustules. Copper and zinc, darn useful metals themselves, also make appearances in the frustule, but are more distributed. Why? What are they doing in there? What makes them different from iron and manganese?
The authors suggest that iron and manganese are part of metalloproteins key to initiating silica polymerization. But, they concede that they could just be sorbing onto the polymerizing silica. Still, even if that is the case, why do they sorb on in that region alone? If they are producing metalloproteins, what’s the genetic sequence coding for them? Are they unique to diatoms? Could they be reproduced in the lab and used to, say, nano-structure silicon chips?
They also single out paleoclimate as standing to benefit from this technique. No kidding! The ability to image metal distributions in a single diatom cell would be extremely powerful. Get the amount of time down from the 36 hours they report having to take for this procedure to the 7 they say is possible, and you could compare individual cells of the same species from different time periods relatively quickly. No one today is even close to being able to do that.
 But, perhaps the most valuable perspective we have gained through this paper is just how little we understand these guys. Here are the diatoms, with their freaky-deeky opaline hard parts producing 20% of our oxygen. Their frustules often make up the bulk of sediments in iron-limited high-nutrient, low-chlorophyl regions of the ocean, yet at least this diatom species appears to use iron for forming its frustule. If all diatoms use iron similarly, they have an extra energy expenditure and resource allocation for iron. Yet, diatoms still manage to out-compete so many other families of phytoplankton. How do they do it? This paper doesn’t have answers to these questions, but it very well may turn out to be the first foot in the door.
de Jonge, M., Holzner, C., Baines, S., Twining, B., Ignatyev, K., Diaz, J., Howard, D., Legnini, D., Miceli, A., McNulty, I., Jacobsen, C., & Vogt, S. (2010). Quantitative 3D elemental microtomography of Cyclotella meneghiniana at 400-nm resolution Proceedings of the National Academy of Sciences, 107 (36), 15676-15680 DOI: 10.1073/pnas.1001469107
Share the post "Scientist In Residence: Danny Richter on Diatoms and X-ray Whosamagidgets"

