Last week’s earthquake in Chile sent a tsunami throughout the Pacific. It was devastating for coastal Chile, but the waves were weaker than expected all the way up here in the North Pacific. That doesn’t mean that it wasn’t here, though! Here are three ways of viewing the tsunami on the North Pacific.
1) The NOAA animation. (H/T Oceanographer’s Choice). This animation shows how the earthquake caused waves to move through the entire Pacific basin. The variation in the waves is caused by constructive and destructive interference, as well as by seamounts on the ocean floor. The wave reaches southern California and Hawaii 12-15 hours after the earthquake itself.
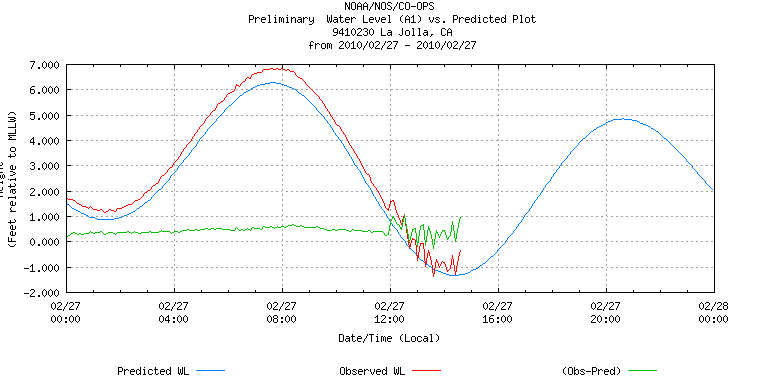
2) The SoCal tide gauge. This is data from the tide gauge on the Scripps Institution of Oceanography pier in San Diego, CA, where I am a student. (Thanks to James Means for emailing it out). The blue line is predicted, the red line is observed, and the green line is the different between the two. See all those squiggles? That’s the tsunami waves hitting the pier! Fortunately for me and the rest of SoCal, the amplitude is less than a foot, and is dwarfed by the normal tidal variation. (Damn you, global draining!)
3) The poor unfortunate dock. (H/T Rick). The popular conception of a tsunami is as a huge, cresting wave. But actually tsunamis aren’t necessarily high – sometimes they are like a small wave that just keeping coming towards the shore for a really long time. All that water just keeps rising and rising until the shore is flooded. This is nicely illustrated by this video taken by Nelson Hamilton on the Hawaiian island of Lana’i, showing a dock being flooded over 58 seconds. If the tsunami had been larger, all that water would have kept moving onto the shore.


