I’ve been absolutely fascinated by 2 things recently: amazing images of typhoons and animated gifs. In regards to the former, check out this amazing 3D movie dissecting Typhoon Neoguri’s rainfall (and giving me the spins).
In response to my second obsession, I give you this animated GIF of that same typhoon clipped from one of my favorite visualizations of atmospheric and ocean data, http://earth.nullschool.net/.
But tracking the atmospheric winds isn’t why I was at http://earth.nullschool.net/. I call that child’s play. I was there to find me a cold wake. And did I ever!
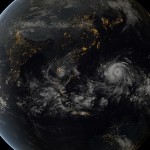
The colors in the animated gif above represent the sea surface temperature anomaly. Red means warmer than average water, while blue means colder than average. As Neoguri moves northwestward, evolving from a tropical storm to a super typhoon, you can see the black and blue cold wake forming behind it (sort of looks like Typhoon Neoguri socked it to the ocean). Ferocious winds mix the upper ocean, bringing cold water from the briny deep to the surface, cooling the ocean surface and forming a cold wake.
This is just the start of typhoon season in the Pacific. Typhoons are destructive and deadly. These images make you appreciate their immense power, altering not only the air around them but the water underneath them. Neoguri was the first storm to intensify to a super typhoon and won’t be the last, along with the tell-tale chilly trail.