 Confronting Climate Contrarianism looks into the claims made climate contrarians and how they (mis)use the scientific literature.
—————————————————————–
In a textbook example of climate contrarians misusing the primary literature for an anti-scientific agenda, Robinson et al. (2007) are seemingly flippant about decades of research showing how humans have affected the climate since the onset of the Industrial Revolution. One of several examples is their reporting of atmospheric methane concentrations over the last few decades. At face value, Robinson and colleague’s Figure 20 (below) seems straightforward, until one takes a closer look at how it used the primary literature cited for the figure.
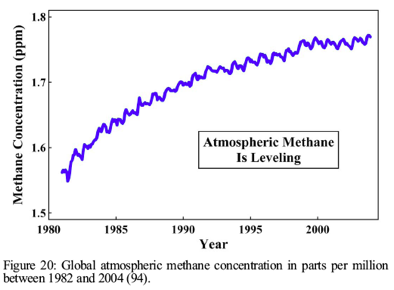
The content of Figure 20 describes a trend of atmospheric methane concentrations in parts per million (ppm) since 1980 to what appears to be right up to the publication date of the paper near 2007. In a large, obvious box they declare that atmospheric methane is leveling. Given their graph, it can’t really be concluded that atmospheric methane is leveling off. Leveling connotes a stop in rate of accumulation, in this case concentration per year. Methane accumulation is slowing but has not ceased. One can imagine a trajectory of continuing this slower rate of concentration for a long time just as easily as imagining that the rate will rapidly asymptote for the long term.
The paper cited as the reference for this graph is Khalil et al. (2007) which discusses the trends and cycles of the sources and sinks of atmospheric methane. The primary focus of the paper was analyzing the cyclical nature of the trendline, not reporting the concentration of methane. The data set contains 23 years of data from seven stations spread out globally on two atmospheric monitoring networks. Robinson et al. (2007) present their Figure 20 much in the same way as Khalil et al. (2007) present their Figure 1 (below). The scale is essentially the same except Robinson et al. (2007) presents the data in parts per million (ppm) instead of parts per billion (ppb), perhaps to make the changes seem less dramatic.
The trend and supporting data were first described by Khalil and Rasmussen (1990) for the first 8 years of monitoring from 1980-1989, in agreement with two previous studies. In contrast to Robinson et al. (2007) (see quote below), they opened the first sentence of the 1990 paper with “There is no longer any doubt that the global concentration of atmospheric methane is increasing…” (pg 549). Seventeen years later, global concentrations of atmospheric methane continue to increase, albeit at a slower rate of accumulation. In my opinion, they presentation of the data show even less that methane is leveling, but certainly slowing down.

In their brief assessment of atmospheric methane concentrations, Robinson et al. (2007) incoherently conclude,
“Methane is also a minor green house gas. World CH4 levels are, as shown in Figure 20, leveling off. In the U.S. in 2005, 42% of human-produced methane was from hydrocarbon energy production, 28% from waste management, and 30% from agriculture (95). The total amount of CH4 produced from these U.S. sources decreased 7% between 1980 and 2005. Moreover, the record shows that, even while methane was increasing, temperature trends were benign.”(pg 8 )
It is not clear how they arrived at the 7% figure since they do not give us enough information or a reference, unless it was also from reference 95, but even from their own Figure 20 we see there was that 0.2 ppm was gained during those 23 years. If anything the interpretation may be, anecdotally speaking anyways, that the slowing down is the result of global awareness of the issue of climate change and an increase in government regulation of pollutants since the 1980s. That is, if their 7% reduction of total CH4 from U.S. sources alone is to be believed.
What happened in the 1980s that might have slowed down methane? In the US at least, the 1970 amendments to the dysfunctional 1963/1967 Clean Air Act created a regulatory framework for air quality and statutory deadlines for compliance. The 1977 amendments required new factories and power plants to install the most current pollution control technologies. By the time the 1980s came around, sufficient time would have occurred for us to see the benefits of this legislation. Of course, this would confirm that humans can and do manipulate the environment via greenhouse gases. An alternative is sampling bias (see paragraph below).
The choice of paper to cite was interesting, not in the least because it wasn’t the original report as I described above, but because Khalil et al. (2007) talk very little about the human causes of climate change in this paper. This was a mechanistic paper that used sophisticated statistical techniques to study the roles of sinks and sources in the inter-annual cycles that were observed over a 23-year history of recording methane concentrations. The authors’ themselves caution against over-interpretation,
“The slowdown of methane trends has been known and discussed for a long time; however, it is particularly noteworthy that the decrease of the methane trend is not a new phenomenon, but rather it has occurred from the time that systematic measurements were first taken. Most probably it started even before then. Since fluctuations are superimposed on a generally decreasing trend, there have been years in recent times when methane has not increased at all or has even fallen slightly relative to the previous year. This has attracted more interest than in the past when there were similar short-term down turns but on the whole methane still increased over previous years.” (pg 2131, emphasis mine)
It may be a case of using the most recent paper that reports the methane concentrations or a lack of knowledge of the literature, but Khalil and Rasmussen (1990) do discuss openly the human caused component.
Which brings me to most important smoke screen enacted by Robinson et al. (2007) when discussing methane – the blatant ignorance of a body of historical paleoclimate data. Robinson and colleagues’ paper seemed to assume that data collection only started in 1980, and made no mention of historical data gathered trapped in ice cores spanning over 420,000 years (Petit et al. 1999). The Vostok ice cores are only a point estimate of the climate at just one location, but represent an important window into the history of climate. But Robinson and colleagues are flippant about the ice core data, writing “Ice-core records contain substantial uncertainties (58), so these correlations are imprecise.” (pg 6). Interestingly, the data were good enough for them to cite and use when justifying their assertion that increases in CO2 and CH4 are merely due to periodic oceanic out-gassing during the interglacial periods. What was not recognized is that prior to the 1880s methane concentrations never exceeded 800 ppm during peak interglacial periods during the over 420,000 years time series trapped in the Vostok ice core.
The two graphs below were compiled by David Stang using data from Petit et al. (1999) (Vostok ice core data), Ethridge et al. (1992) (data from 1841-1978), Khalil et al. (1993) (data from 1979-1992) and publicly available data from NOAA-ESRL (2008) (data from 1984-2008) and shows the sharp acceleration of methane accumulation in the atmosphere from several stations since the mid-19th century. Methane concentrations are nearly 2.5 times the maximum from all previous records. The most recent data from NOAA-ESRL for 2009 has methane concentrations reaching up to 1900 ppb (accessed October 25, 2010).
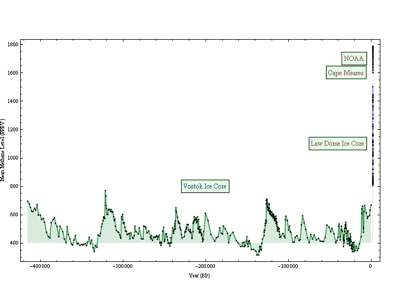
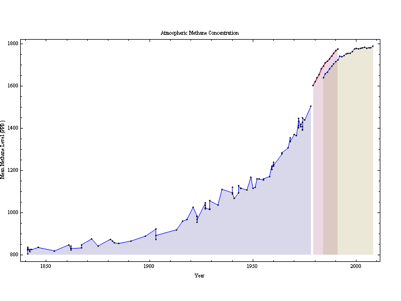
In conclusion, Robinson et al. (2007) misrepresent the science and are selective about the literature behind their discussion of atmospheric methane concentrations. To reiterate, while the rate of methane accumulation in the atmosphere is decreasing, the amount of methane in the atmosphere is increasing to record levels every year. Leveling off does not imply that methane concentrations are themselves decreasing; on the contrary methane is the highest it has been in over 400,000 years. Decreasing a rate of accumulation is not the same as decreasing the concentration. This decrease may in fact be due to increased human awareness of the powerful greenhouse effect produced by methane gas and growing governmental regulation of its use around the world. This might be arguable, but based upon its short residence time in the atmosphere (~12 years) it may be a evidence that reducing our carbon footprint in the atmosphere can contribute effectively to climate change mitigation.
References:
Etheridge, D., Pearman, G., & Fraser, P. (1992). Changes in tropospheric methane between 1841 and 1978 from a high accumulation-rate Antarctic ice core Tellus B, 44 (4), 282-294 DOI: 10.1034/j.1600-0889.1992.t01-3-00006.x
Khalil, M., & Rasmussen, R. (1990). Atmospheric methane: recent global trends Environmental Science & Technology, 24 (4), 549-553 DOI: 10.1021/es00074a014
Khalil, M., Rasmussen, R., & Moraes, F. (1993). Atmospheric Methane at Cape Meares: Analysis of a High-Resolution Data Base and Its Environmental Implications Journal of Geophysical Research, 98 (D8), 14753-14770 DOI: 10.1029/93JD01197
Khalil MA, Butenhoff CL, & Rasmussen RA (2007). Atmospheric methane: trends and cycles of sources and sinks. Environmental science & technology, 41 (7), 2131-7 PMID: 17438753
NOAA-ESRL (2008) GLOBALVIEW-CH4: Cooperative Atmospheric Data Integration Project – Methane. CD-ROM, NOAA ESRL, Boulder, Colorado [Also available on Internet via anonymous FTP to ftp.cmdl.noaa.gov, Path: ccg/ch4/GLOBALVIEW].
Petit, J., Jouzel, J., Raynaud, D., Barkov, N., Barnola, J., Basile, I., Bender, M., Chappellaz, J., Davis, M., Delaygue, G., Delmotte, M., Kotlyakov, V., Legrand, M., Lipenkov, V., Lorius, C., PÉpin, L., Ritz, C., Saltzman, E., & Stievenard, M. (1999). Climate and atmospheric history of the past 420,000 years from the Vostok ice core, Antarctica Nature, 399 (6735), 429-436 DOI: 10.1038/20859
Robinson AB, Robinson NE, Soon W (2007) Environmental effects of increased atmospheric carbon dioxide. Journal of American Physicians and Surgeons 12:79-90.
Share the post "Confronting Climate Contrarianism II: Methane Accumulation in the Atmosphere"



In other words:
Just because less water per second coming out of the tap, that doesn’t mean the sink is emptying.
This sink is always emptying. Methane soon reacts to form (in a somewhat roundabout way) CO2 and H2O. At a steady rate of emission the concentration will level off, and this is fairly close to happening.
Look, climate change deniers are a rotten lot, but on rare occasions they may be right on some detail.
There are places to check things like methane. One place is Real Climate (RC). Here is their latest on methane:
http://www.realclimate.org/index.php/archives/2010/03/arctic-methane-on-the-move/
and here is their next to latest
http://www.realclimate.org/index.php/archives/2009/11/its-all-about-me-thane/
covering recent research on methane.
We all need to understand denialism in the modern sense: A set of rhetorical tactics used against science (usually) for unlaudable motives.
http://scienceblogs.com/denialism/deck.php
Climate change is a massive slow motion train wreck, and denying it is a very low activity. Deniers should and can be confronted head on. Deep Sea News might look at ocean heat content, acidification, coral death from just plain heat and especially transient hot spots, Arctic thawing, and so on.
By the way, methane concentration is well above historical levels, and this is evidently due to human activity.
Thanks for your comment Pete. The intent is more to look at how they use the literature. Not sure what you mean by “they may be right on some detail” in this instance. Methane does appear to approach an asymptote, and the net effect may be 0, but that doesn’t mean it will go away.
I can concede that I might be reading too deeply into Robinson et al. (2007), but I would argue that is necessary when this literature is used as peer-reviewed ammo by deniers in congress. It is important to show that some vital components of the story are being left out.
The posts from Real Climate are good, and I agree that methane is more about an accounting exercise and is a small contributor relative to CO2, but I am unclear how they relate to my thesis that Robinson et al. (2007) misrepresented the literature and science behind their look at methane concentrations. As I said, “One can imagine a trajectory of continuing this slower rate of concentration for a long time just as easily as imagining that the rate will rapidly asymptote for the long term.” Furthermore, leaving out a discussion of the ice core data was irresponsible, especially since it showed that natural cycles cannot explain the recent increase in CH4.
Thanks for reading and commenting!
Ah, so this is what that whole “total rate of concentration” business was all about.