Knowing how diverse an ecological community is should be a simple matter. At the most basic level, we can go into the field take a sample and count the number of species. I know that when I look into my refrigerator that I have a beer diversity of 2. I have a few Guinness* and a few Duck-Rabbit Porter left over from last weekend.
Is this high diversity or low? Simply knowing the number of kinds of beer in my own refrigerator is not enough. I need comparison! The market down the street is chock-a-block of beer. For the sake of argument will say the market contains 50 kinds of beer and thus my house has low beer diversity in relation. Of course, on the other hand my house has greater beer diversity than the local preschool. At least I hope so!
The metric we just discussed is richness, i.e. what is the beer richness of my house, the supermarket, and the preschool. One of the most common metrics to quantify any ecological community is species richness, the number of species within a locality. The other important concept here is that there is more to diversity than just knowing that a locality has x number of species. It is important than some habitats possess more or less species as this yields information about the underlying ecological and evolutionary processes.
However, richness is just one part of the puzzle. What I didn’t tell is that I have 5 Guinness and 1 Duck-Rabbit Porters. Now just a few days ago, I had exactly 6 Guinness and 6 Duck-Rabbit Porters. So beer richness is unchanged, but diversity lowered. How? The second piece of the puzzle is evenness. Evenness is a measure of the equality or distribution of individuals, in our examples bottles, among species, here kinds of beer. In our example, I had 6 of each and thus high evenness before the weekend. After the weekend, beer diversity became uneven (5 and 1).
You can envision this in an ecological context as well. Two localities both have 5 species and 100 total individuals. But differ in how those species are distributed among species. At locality 1: 96, 1, 1, 1, 1 and locality 2: 20, 20, 20, 20.
Which of these two communities is more even? If you guessed 2 then you are correct! As aside here, evenness can be extremely informative. For example, polluted localities are typically extremely uneven.
Ideally, we would want a way to quantify diversity that would account not only for how many species were at a location but how individuals were distributed through species. As you might guess, we have metrics that do this. At their core, all these metrics basically do something mathematically fancy with the fraction of individuals in each species and then sum all those.
The most prominent and widely used of these is the Shannon-Wiener Index (H’), or Shannon-Weaver Index**. pi here is simply the fraction of individuals in the ith species. So here, we have pi times the log of pi for each species then summed.

Of course we can also separate out evenness and measure this independently with a metric like Peilou’s J’*** (below labeled as E for evenness I presume). Where the H’ from Shannon-Wiener is divided by the maximum value H’ can take (totally equal numbers of individuals among species, S).
![]()

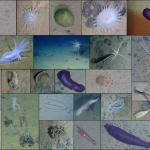
Of course this discussion focuses just on species, but we could just as easily quantify the diversity at other taxonomic levels, genus, family, order, class. We could also more ecologically meaningful groups such trophic types, guilds, and body size classes.
This will be an ongoing series with other topics including: morphological diversity; spatial scale and diversity; alpha-,beta-, and gamma-diversity, similarity in composition, genetic diversity, diversity in the deep sea, phlyogenetic diversity, taxonomic relatedness, etc. Feel free to suggest some topic below as well.
*is the plural of Guinness, Guinni?
**Quite an interesting story here. The index was originally developed by Claude Shannon in 1948. Norbert Weiner, who did not help develop this precise index, did lay out definitions and discussion of the relationship of information and entropy in the 1948 book “Cybernetics: or communication and control in the animal and the machine.” In a later book version of Shannon’s 1948 paper, Warren Weaver wrote the introduction spelling out these ideas for a lay audience. Thus, the two versions, Shannon-Weiner and Shannon-Weaver, probably resulted out of Weaver’s introduction and similarity of names. This confusion has largely gone away and almost any new student will learn of the Shannon-Weiner Index.
***Let’s here it for the women representing! Evelyn Christine Pielou (born February 20, 1924) is a statistical ecologist and an emeritus professor of mathematical ecology at University of Lethbridge, Alberta, Canada.
Share the post "Biodiversity Pt. 1: Richness vs. Evenness or What Kinds Of Beer Are In My Refrigerator"


from my calculations…you’re in need of more beer
abundance of beer should be positively correlated with richness
So I am one who loves to sample rare beers often, and I believe they are critically important to the design of my Maximum Party Area MPA (critical habitat for some professors). At the same time for some I need to make sure that the MPA includes enough bottles of the most popular beers at all times too. Which index can capture both ends of the curve with equal sensitivity so I can properly design my MPA to protect both?
But how does beer diversity influence ecologist function? My guess is that it is a negative relationship. But clearly, experiments must be conducted! And we really need to try both an additive and replacement design here.
jebrynes: My guess is that depleting beer diversity has a negative impact on ecologist functionality.
My bartender told me that the Shannon index of beer diversity is a relic of the Stone Age with no real ecological underpinnings. Rather, Shannon is a measure of uncertainty, designed to crack codes.
He favors Simpson’s index, which calculates the probability that two beers drawn from an infinitely large population will be the same brand. My bartender considers the Simpson index the most appropriate measure of diversity, and won’t permit me to use the Shannon, as not to propagate the myth of its utility. Yet, Dr. M is a beer scholar of good repute, and he invokes the Shannon. How could this be?
Both are special cases of a general entropy index (so in sense the both can measure the same thing). Now the form of these equations can be different so that Simpson’s is more sensitive to evenness and Shannon’s is more sensitive to richness. Of course, what your bartender says is right they differ and as such can yield different patterns. I would not advocate one over the other. Although I could play devil’s advocate and mention that misleading results can be obtained with Simpson’s at low numbers. Of course, I prefer measuring richness and evenness separately instead of lumping them. One should simply realize that both measure different things as does Chao, Ice, and other diversity indices giving greater weight to rare or dominant species. All that is important is to not blindly apply anything and understand how an index, or any statistical method, fundamentally works and what exactly it is measuring. I simply mentioned Shannon-Weiner as a specific example and because it is older by on whole year.
Oooo Entropy. Where all the beer in the Universe slowly disappears until the Universe gets crunked.
Man why couldn’t my college professors used analogies like these. My GPA would’ve been so much better.
That’s an interesting calculation. I had never heard a formul like that before I read this.
I did a research about the impact of Procambarus clarkii on Odonata communities comparing the results in three natural conditions: in total absence of top predators, in presences of fishes and in presences of both P.clarkii and fishes. The number of species was similar among them but the EVENNESS was extremely high in the last one and really low in the others. I think due to the species are not adapted to this new AIS, while in the others `prey/predator` conditions some species are specialized to it and for this reasons are more abundant.
Bye